Statistics jokes might sound nerdy, but trust me, they are secretly hilarious. I have spent hours sifting through charts, graphs, and p-values, only to discover one undeniable truth: math plus puns equals pure comedy gold.
If you think numbers are boring, think again. In this post, we are diving deep into statistics puns that are clever, laugh-out-loud funny, and totally shareable. Ready to turn your spreadsheet into a stand-up show? Let’s go!
- Funny Statistics Mean Time Jokes
- Standard Deviation Shenanigans Jokes
- Best and Funny Regression Laughs
- Hilarious Statistics Probability Jokes
- Kid-friendly Outlier Statistics jokes
- Statistics Hypothesis Humor for Adults
- Funny Correlation Capers for Couples
- Funny Sampling Silliness puns
- Data Point Delights: Confidence Intervals of Comedy
- P-Value Statistics jokes: Testing Hypotheses, Telling Puns
- Funny Confidence Interval Comedy
- Chi-Square Chuckles: Laughing at Categorical Data
- Funniest ANOVA Antics Jokes
- Bayesian Banter: Smart Statistics Jokes for Sharp Minds
- Scatterplot Smiles: Finding Correlation in Comedy
- Conclusion
- FAQs
- What is the famous saying about statistics?
- What are some cool statistics?
- How to teach statistics in a fun way?
- What is a good example of statistics?
- What are the 5 main statistics?
Funny Statistics Mean Time Jokes
Numbers can be mean, but these jokes are absolutely kind of cruel in a funny way. Let’s see how averages can make us chuckle.
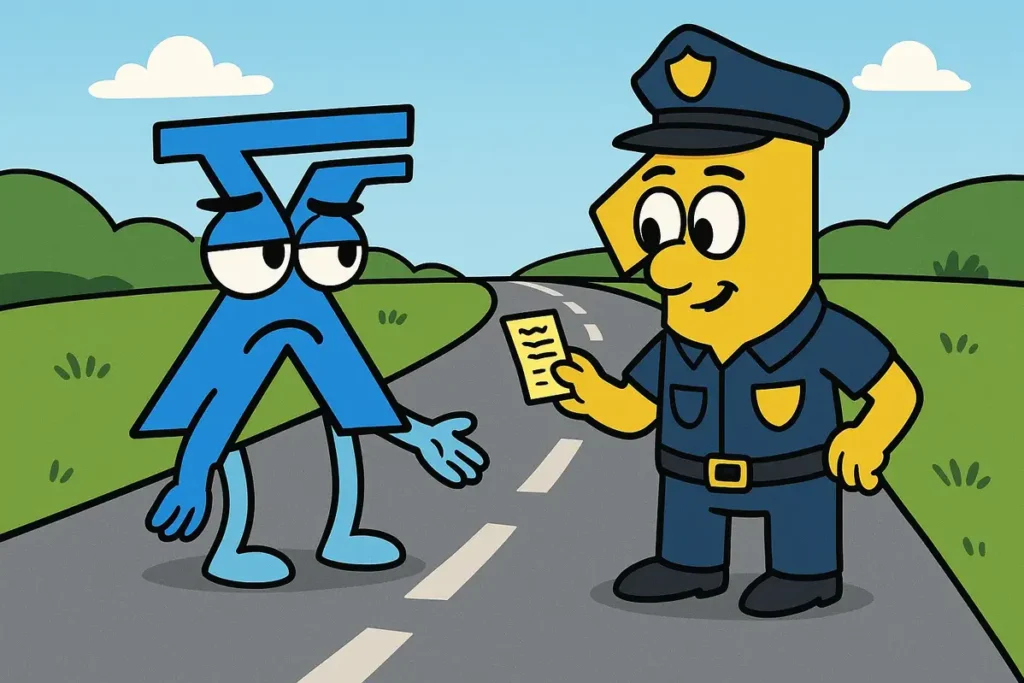
- Why did the mean get a ticket, it kept taking the average road.
- I told my friend I was the mean of our group, he said I was just central.
- Why don’t means play hide and seek, they always get found in the middle.
- The mean walked into a bar, everyone else followed because they were attracted to the center.
- Standard deviation told me I was too extreme, so I calmed down.
- Why was the median so popular, everyone wanted a middle ground.
- My math teacher called me mean, I told her I’m just central to the problem.
- I asked the mean if it had feelings, it said I average everything.
- The mean threw a party but only invited numbers within one standard deviation.
- Why did the mean break up with the mode, it couldn’t handle the repetition.
Behind the Punchline: Share these with friends during game night or use them in presentations to lighten up those dreary data slides.
Standard Deviation Shenanigans Jokes
Deviation has never been so delightful. Let’s see how statisticians secretly laugh at variability.
- Standard deviation walked into a bar, everyone else was spread out.
- I like my coffee like my data, with a little deviation.
- Why was the data shy, it didn’t want to deviate too far.
- My graph got divorced, the points just deviated from the mean.
- I threw a standard deviation party, everyone was slightly off.
- Variance said to the mean, stop being so predictable.
- I like my jokes like my stats, unexpected with just a tiny deviation.
- Why did the bell curve feel lonely, it was too normal.
- Standard deviation tried stand-up comedy, it went off-script every time.
- Data points gossip too much, they just cannot keep to the standard.
Behind the Punchline: Perfect for office emails or Slack messages to lighten up meetings with a nerdy twist.
Best and Funny Regression Laughs
Predicting outcomes has never been this funny. Let’s see how regression models steal the show.
- Why did the line break up with the scatter plot, it felt uncorrelated.
- Regression tried dating, every relationship was linear.
- I asked the model out, it said I only do straight lines.
- My data’s love life is completely non-linear.
- Regression told the outlier, stop standing out please.
- Why did the slope get promoted, it knew how to rise to the occasion.
- The intercept called, it wanted to start over.
- My predictions are like my jokes, sometimes they just do not fit.
- Regression tried therapy, it needed help finding its line of best fit.
- Why did the scatter plot go to the party alone, no one was in its range.
Behind the Punchline: Use these in classrooms or workshops to make learning regression more lively.
Hilarious Statistics Probability Jokes
Chance has never looked this cheeky. These probability jokes keep the odds in your favor.
- I asked my date to choose probability over certainty, they said 50/50 chance I will show up.
- Why did the coin break up with the die, too many sides.
- Probability said, I am just hoping for the best.
- I had a 100 percent chance of laughing at this joke, it is guaranteed.
- Why was the statistician calm, he understood the odds.
- Events in my life are independent, except Mondays.
- Probability tried stand-up, it had a 50/50 success rate.
- I bet my luck on a statistic, it lost of course.
- Conditional probability said, I will only appear if the conditions are right.
- Chance met random, it was love at first uncertainty.
Behind the Punchline: Drop these in party conversations or social media captions for a quirky, intelligent laugh.
Kid-friendly Outlier Statistics jokes
Some numbers just refuse to fit in, and that is where the real comedy begins.
- Outlier walked into a bar, no one noticed but everyone laughed.
- I tried to include the outlier, it refused to mingle.
- Outliers are like comedians, they always stand out.
- Why did the outlier get a job in Hollywood, it was naturally dramatic.
- I took my data out, one point refused to follow the crowd.
- Outliers go to parties but never follow the trends.
- My love life is like an outlier, unexpected and unpredictable.
- Outliers always steal the spotlight, they do not follow the line.
- Why did the outlier feel lonely, it was too far from everyone.
- Outlier applied for a promotion, it had extraordinary potential.
Behind the Punchline: Perfect for talking about that quirky friend or using in presentations to illustrate uniqueness.
Statistics Hypothesis Humor for Adults
Testing assumptions has never been so entertaining.
- Null hypothesis walked into a bar, no one noticed a difference.
- I tested my hypothesis, it turned out hilarious.
- Alternate hypothesis said, let us spice things up.
- My hypothesis, this joke will make you laugh.
- P-values are shy, they never reveal significance immediately.
- Hypothesis met reality, it was awkward at first.
- I rejected the null, it just was not funny enough.
- Hypothesis dating tips, always test before committing.
- Significance level asked, am I enough for you.
- Statistical testing is like dating, always a gamble.
Behind the Punchline: Great for science clubs, nerdy group chats, or your next Zoom icebreaker.
Funny Correlation Capers for Couples
Some things just go together, hilariously.
- Correlation walked in with causation, they were not related but everyone assumed.
- I correlated coffee with productivity, it is highly significant.
- Why did correlation break up with causation, it wanted independence.
- Correlation said, we are just aligned, not committed.
- I found a correlation between jokes and laughter, shocking.
- My life correlates perfectly with pizza intake.
- Positive correlation, that is just me smiling at ice cream.
- Correlation parties are fun, causation always ruins the mood.
- My happiness correlates inversely with Mondays.
- Correlation said to causation, stop trying to influence me.
Behind the Punchline: Use these at casual chats or even in workplace reports to lighten up data-heavy slides.
Funny Sampling Silliness puns
Picking the right sample can be funnier statistics jokes than you think.
- I sampled my friends, they were all statistically funny.
- Sample size matters, unless you are joking, then go big.
- Random sampling said, surprise.
- I asked for volunteers, they were a representative sample.
- Sampling bias, just like picking your favorite pun.
- I tried to sample the population, most preferred pizza.
- Why did the sample feel lonely, the population ignored it.
- Sampling is like dating, hope you picked the right one.
- My sample laughed 100 percent, success.
- Biased sample walked in, it thought it was the center of attention.
Behind the Punchline: Perfect for icebreakers, workshops, or just cracking nerdy jokes at brunch.
Data Point Delights: Confidence Intervals of Comedy
Every number tells a story, especially the funny ones.
- Data point said, I am unique, do not normalize me.
- Outlier data has the best stories.
- Each point on the chart has a personality, mine are hilarious.
- Data point felt lonely, it was not connected to the trend.
- Why did the data point blush, it got plotted.
- I told my points a joke, they all reacted differently.
- Data points love attention, they always cluster together.
- My scatter plot told jokes, they were widely dispersed.
- Data points are shy, they only reveal themselves to graphs.
- I have points of interest, all statistically significant.
Behind the Punchline: Use these in presentations, emails, or casual chats to show data has a funny side.
P-Value Statistics jokes: Testing Hypotheses, Telling Puns
Significance has never been so comical.
- My p-value walked into a bar, it was barely noticeable.
- P-value said, am I significant.
- I rejected the null, it was no fun anyway.
- P-values are shy, they hide in plain sight.
- My p-value went on a date, no significant difference noticed.
- Why was the p-value nervous, it was being tested.
- Statistical significance is just a fancy way of saying, interesting.
- P-value tried stand-up, it bombed insignificantly.
- I told my p-value a joke, it barely reacted.
- P-value asked, do I matter, only the alpha knows.
Behind the Punchline: Great for sharing with fellow statisticians or using in nerdy social media posts.
Funny Confidence Interval Comedy
Numbers can be confident, and hilarious.
- Confidence interval walked into a bar, everyone knew the range.
- I feel 95 percent confident you will laugh at this joke.
- CI said, I am pretty sure about this.
- My joke lies within a 95 percent CI, it is statistically funny.
- Confidence intervals are like hugs, they give a range of comfort.
- CI tried flirting, it ranged between awkward and cute.
- I told my CI a secret, it stayed within bounds.
- Confidence interval feels better than a mean.
- Why was the CI nervous, it had a range of outcomes.
- CI tried stand-up, it was almost perfect.
Behind the Punchline: Perfect for classrooms, meetings, or clever tweet threads.
Chi-Square Chuckles: Laughing at Categorical Data
Categorical data is more fun than you think.
- Chi-square walked into a bar, it checked if expectations matched reality.
- I tested independence, it was surprisingly funny.
- Categorical variables laughed, it was a good fit.
- Chi-square told a joke, everyone was significantly entertained.
- My test had degrees of freedom, it really loosened up.
- Observed values surprised expected values, it was a riot.
- Chi-square loves parties, they are always a good fit.
- I asked my test for advice, it was independent.
- Why did the chi-square blush, it saw unexpected results.
- My categorical data is hilarious, it is all significant.
Behind the Punchline: Share these with students or statisticians to turn dry lessons into fun.
Funniest ANOVA Antics Jokes
Variance analysis can be riotous when you let it.
- ANOVA walked into a bar, it tested all group differences.
- I performed an ANOVA, it was highly significant.
- Groups laughed, they found differences amusing.
- My data had multiple levels, it was dramatic.
- Why did ANOVA go to therapy, it had too many groups.
- The F-test said, I am significant, deal with it.
- ANOVA parties are fun, everyone compares notes.
- I found a difference, it was not random.
- Multiple comparisons made it awkward but funny.
- ANOVA walked out, it had tested enough patience.
Behind the Punchline: Excellent for workshops or nerdy cocktail parties.
Bayesian Banter: Smart Statistics Jokes for Sharp Minds
Updating beliefs is funnier than you would expect.
- Bayesian walked in, it updated its prior with new info.
- I believed my jokes were funny, posterior confirmed.
- My prior was skeptical, posterior laughed.
- Bayesian analysis tried stand-up, it learned from feedback.
- Prior probability said, I am not sure.
- Posterior probability replied, now I am.
- Bayesian thinking is like humor, always evolving.
- I told my prior a joke, it was uncertain.
- Posterior is confident, it is statistically funny now.
- Bayesian jokes get better with data.
Behind the Punchline: Use these for nerdy humor threads or classroom engagement.
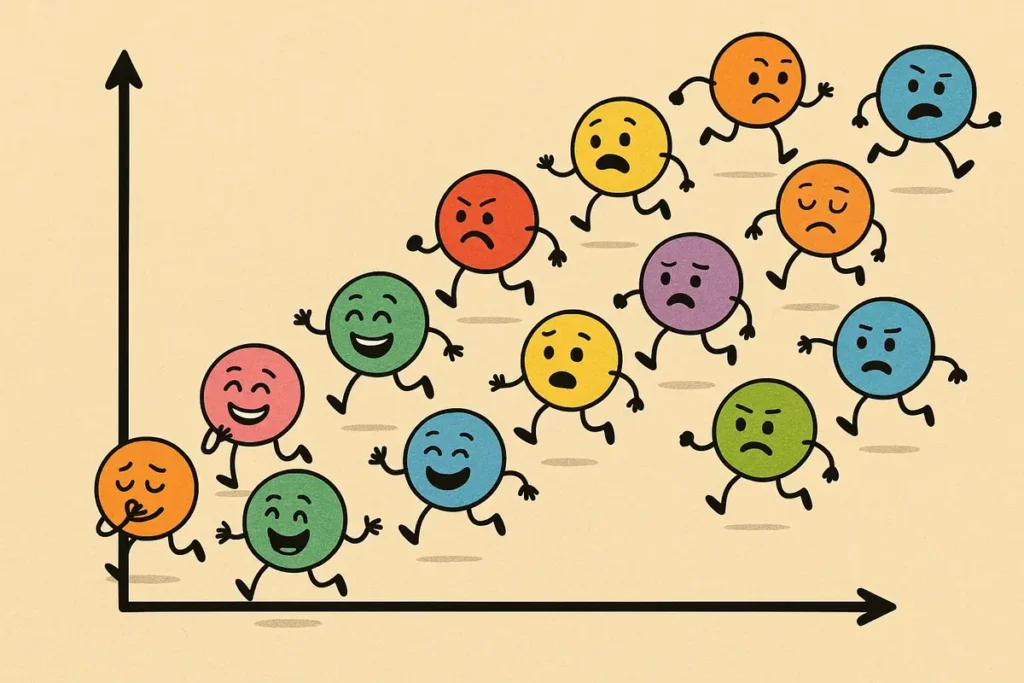
Scatterplot Smiles: Finding Correlation in Comedy
Graphs can giggle too, let’s plot the humor.
- Scatterplot told a joke, everyone dispersed.
- My points plotted themselves, they had a sense of humor.
- I drew a line, they laughed along the way.
- Outliers always steal the spotlight, they are hilarious.
- Trend lines tried comedy, they sloped to success.
- Scatterplot parties are fun, points always mingle.
- I asked my plot to tell a story, it was well-distributed.
- Correlation smiled, it was positively funny.
- Data points whispered secrets, they were statistically significant.
- My scatterplot is hilarious, just look at the spread.
Behind the Punchline: Great for illustrating charts, dashboards, or just nerdy laughs with friends.
Conclusion
Who knew statistics jokes could be this fun? From scatterplots to p-values, these puns prove that numbers have a sense of humor. Drop your favorite joke in the comments, share this with your math-loving friends, and keep the laughter going, because laughter is the best way to make statistics a little less serious.
FAQs
What is the famous saying about statistics?
The most famous saying is “There are three kinds of lies: lies, damned lies, and statistics.” It’s a witty reminder that numbers can be twisted to say almost anything, unless, of course, they’re used to make statistics humor!
What are some cool statistics?
Some stats are mind-blowing. For example, there’s a 1 in 292 million chance of winning the Powerball lottery, and 90% of the world’s data was created in just the past few years. Now that’s some data worth laughing at!
How to teach statistics in a fun way?
Start with humor! Using funny examples, memes, and statistics Puns helps students relax and actually enjoy learning. When data turns into laughter, engagement skyrockets.
What is a good example of statistics?
A great example is calculating the average score in a class test. It shows how one number can summarize a whole story, a mix of highs, lows, and a few outliers who probably need tutoring or a nap.
What are the 5 main statistics?
The five key types of statistics are mean, median, mode, variance, and standard deviation. Together, they explain patterns in data, and sometimes, they’re the punchline in a good statistics jokes.
You Might Also Like

Punning since forever
I’m Amanda from Seattle, where the rain feeds my sense of humor. Puns are my happy place, and I’ve been crafting them since I could talk. Join me on Punopedia for wordy fun that brightens your day!

